9/25/2017
Have you ever walked into a meeting to be greeted by a stack of paper full of so much data you don’t even know where to start? You need a data dashboard!
The dashboard of your car is full of valuable information. You use your speedometer to track your speed, your odometer to measure progress on a trip, and your check engine light to monitor your engine’s health. In short, your car’s dashboard allows you to make quick, informed decisions which successfully get you to your destination. A data dashboard does exactly the same thing for your program or project, “leveraging stakeholders’ most powerful sense – vision – to make evidence-based decisions.” Further, just like it is important for your gas gauge to display the amount of gas you have in real time, data dashboards allow for much more frequent updates and reporting. This is because they are interactive, responding immediately to changes in data while also allowing stakeholders and data users to dive into the details for monitoring, exploring, or strategic purposes.
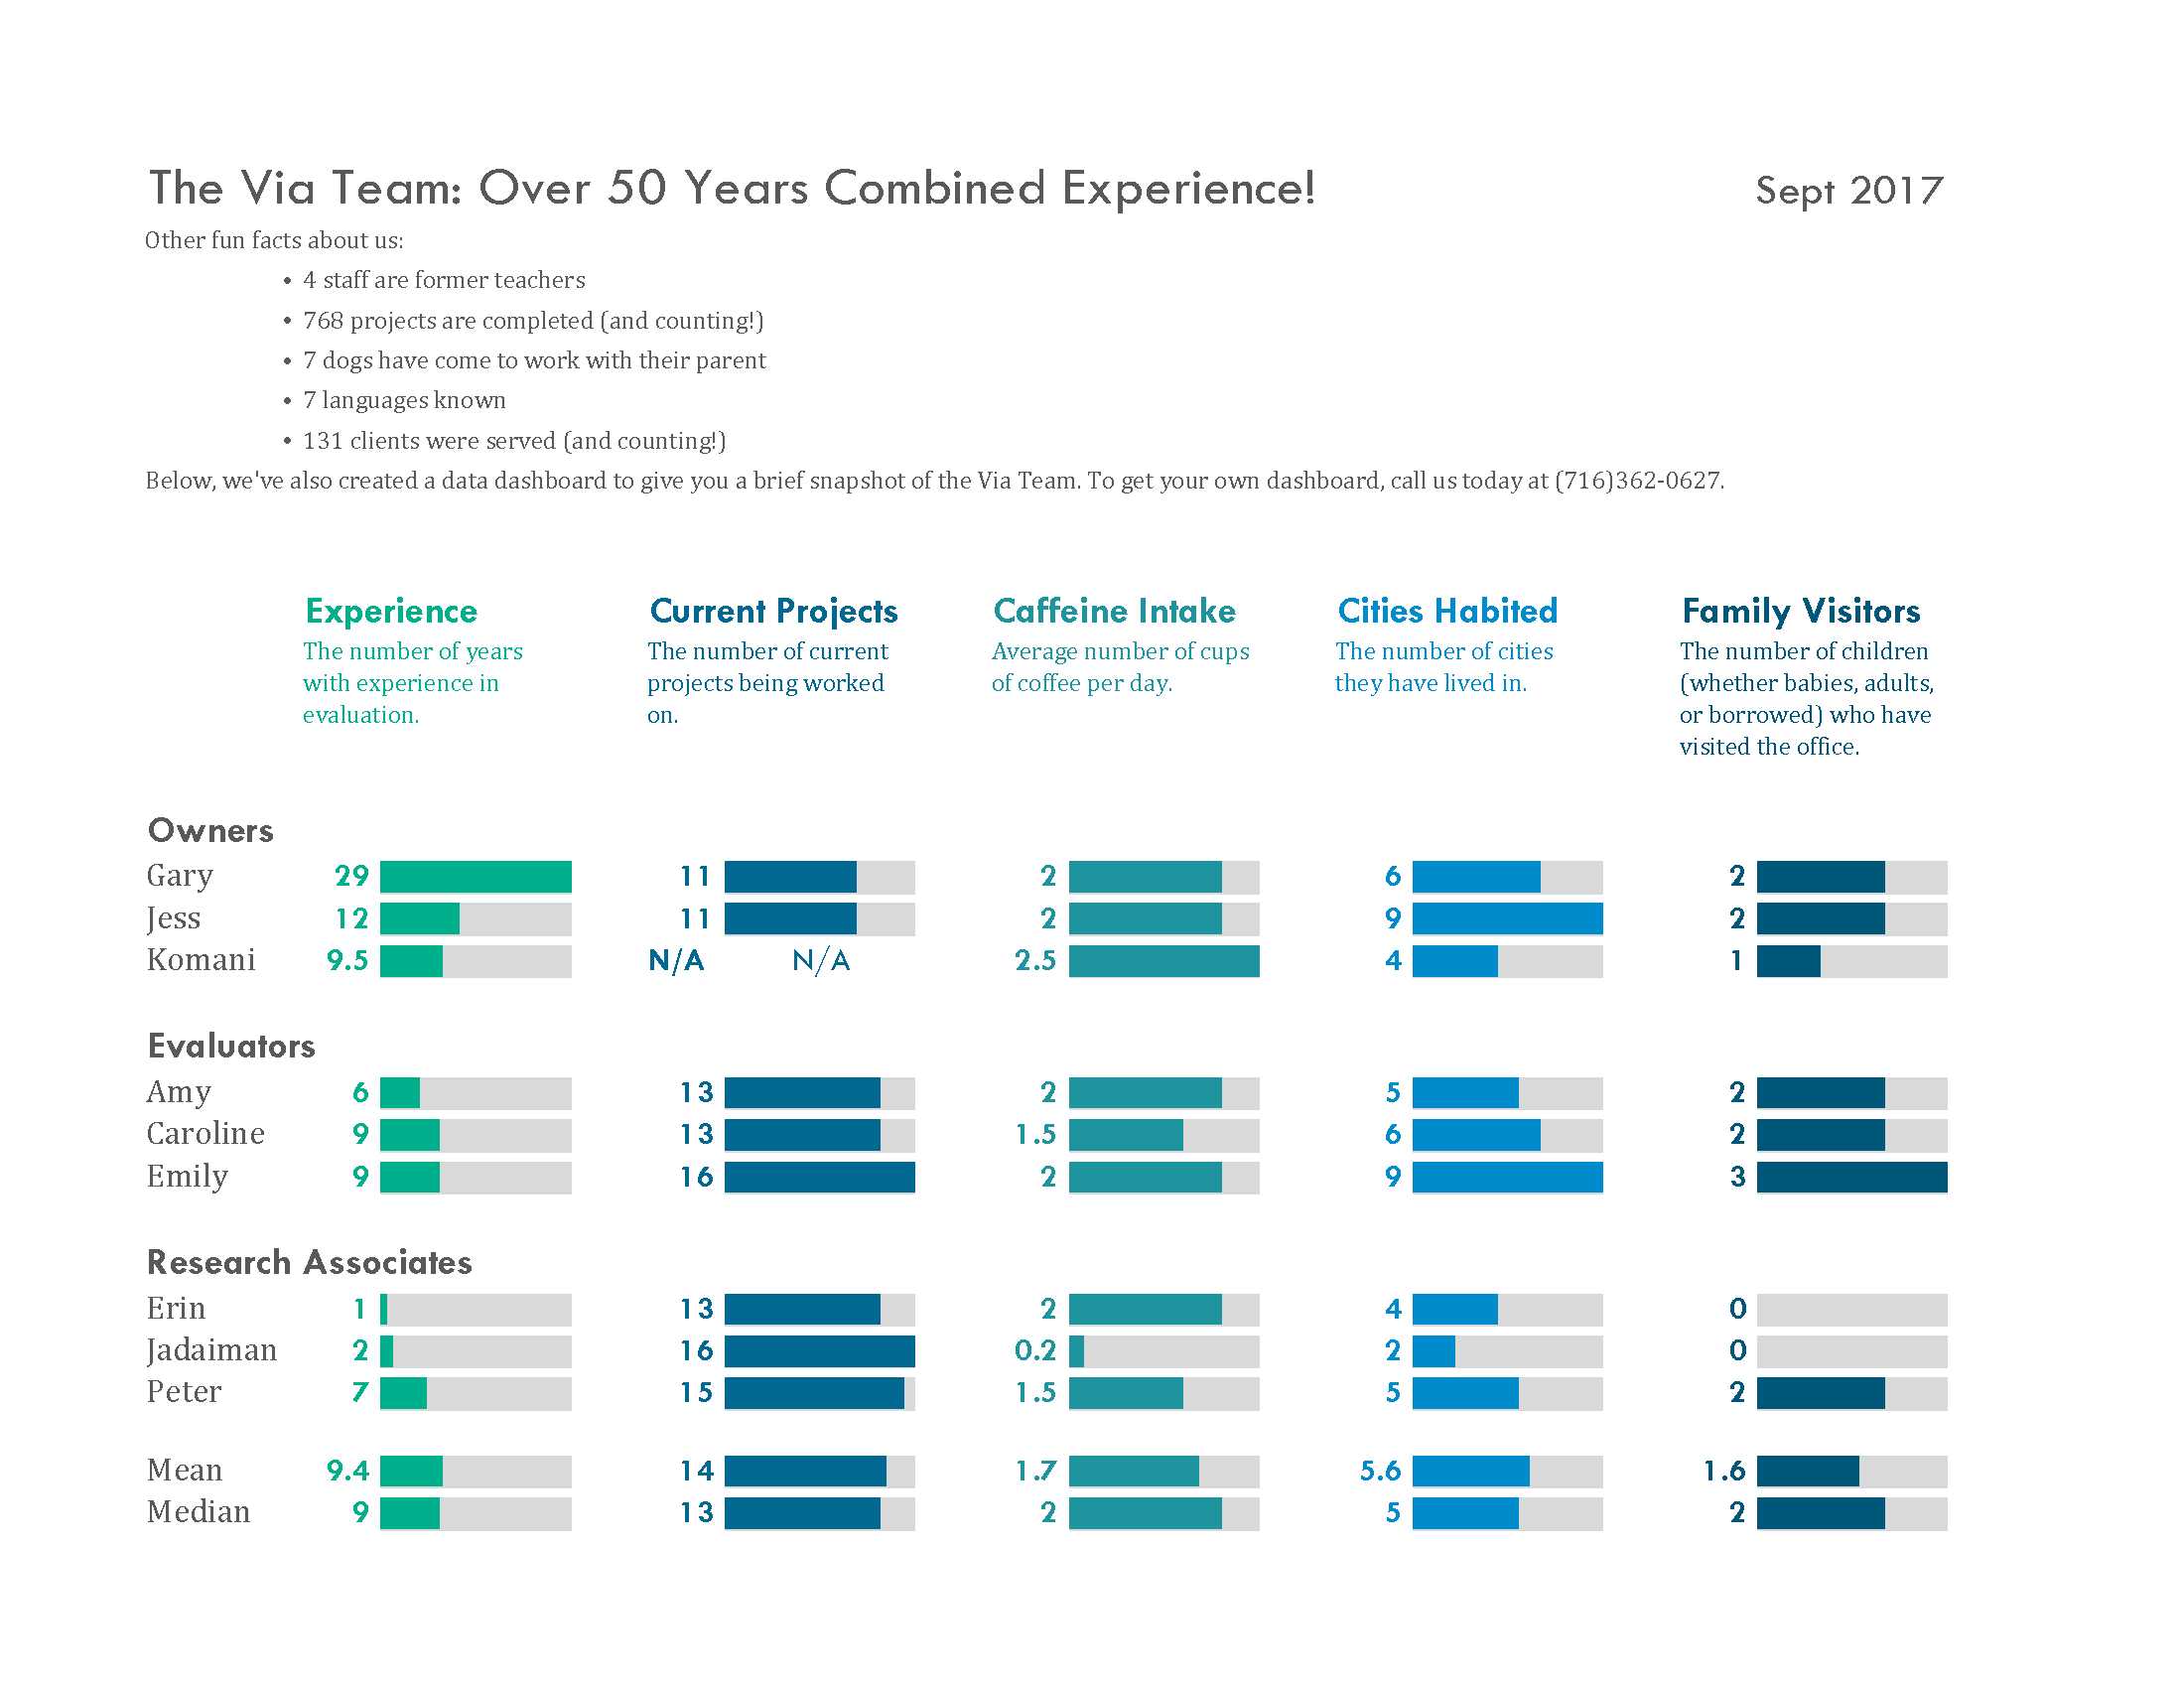
The best part? Dashboards are very easy to design in a way that also makes them easy to print – perfect for that next meeting! Check out this fun one we made about our very own Via Team [below], and let us help you visualize your data by contacting us at (716)362-0627 or by email at [email protected]